

New research from Colliers in Arizona estimates multifamily in Phoenix continues to run at a deficit of approximately 20,000 units short of meeting demand for 2020-2025.
In a research update special report entitled, “Anatomy of a Unit Demand Forecast,” Colliers’ analysts cite the Phoenix area’s occupancy rate, population growth and job growth as the primary contributors to the ongoing, seemingly relentless, deficit.
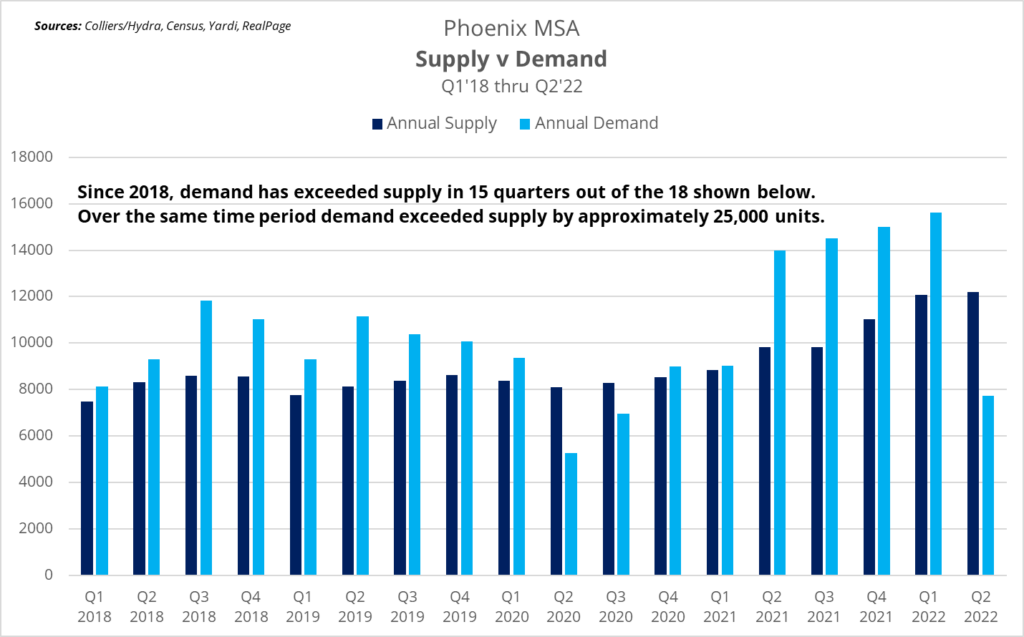
Specifically, the occupancy rate in Q1 2018 was 94.9%. The rate as of Q2 2022 had increased to 96.2%, this despite almost 40,000 units coming online between Q1 2018 and Q2 2022.
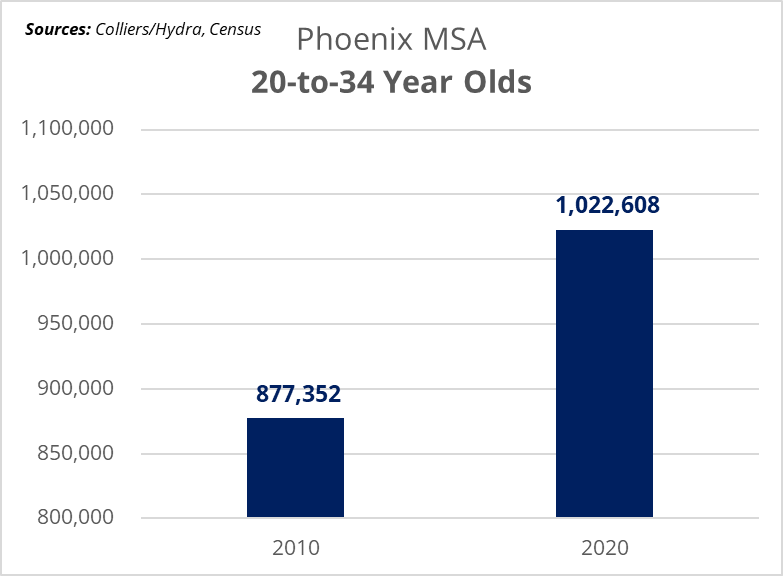
While the area’s population has grown across demographics, an important sector to examine is the growth of the 20-to-34-year-old age group – which is a prime source of multifamily residents. Metro Phoenix was fifth in growth in the U.S. for this demographic from 2015-2020, and Maricopa County as a whole has led the nation for six consecutive years.
In terms of job growth, the report cites data from the Bureau of Labor Statistics showing metro Phoenix employment has bounced back significantly since the pandemic and is currently experiencing employment numbers higher than its already booming pre-COVID totals.
A Look at the Numbers
Colliers is a preferred source of multifamily data for AZBEX and other news outlets covering the sector in large part because of Research Director Thomas Brophy’s reputation as an analyst who takes a deeper dive/wider view of the data affecting the market. In this update, the Colliers team has assembled a broad scope of data that may be of greater than average concern to multifamily trackers.
When all the other considerations are stripped away, a unit demand analysis looks at the number of units the market has and the number of units it can expect to receive and compares those against the number of occupants it has and the number it expects to receive or lose.
The report estimates deliveries during the target period of between 38,000 and 46,000 units.
In reviewing permit data for the market as part of its delivery projection estimating, the report noted the following: “Total housing permits for May 2022 came in at 4,034 with trailing 12-months at 51,864. As a reminder, Phoenix is still considerably lower than last cycle’s peak total housing permits of 68,402 units. Trailing 12-month multifamily permit totals are 15,357 and have been trending 15,000+ since November 2021. Current deliveries have been hovering around 10,000 new units since February 2020. We estimate that approx. 80% of permits are delivered in traditional space with a lag, which puts annual deliveries increasing to around 12,000 heading into 2023. Based on sampling of multifamily developer/builders the current permit-to-completion timeline is approximately 18 months.
“If inventory increases to 12,000 new units added to supply, that will still be below our needed demand based on population growth.”
One point of potential optimism in the report is an increase in density per development. “Specifically, a little over 30% of our current construction pipeline is considered Mid-to-Highrise (5 stories+). From 2000 to 2009, mid-to-highrise projects constituted only 3.8% of all deliveries. From 2010 to 2019 mid-to-highrise projects accounted for 14.8% of all deliveries. It increased even further from 2020-YTD, with mid-to-highrise accounting for 31.2% of all units delivered.
“Phoenix has been a primarily “Garden” style metro (4 stories or less), as such, average quarterly deliveries per project are generally 50-units or less and phased. Whereas Garden style can more easily be phased, whether it be 4,6,8,10 units per building, the same cannot be said for mid-to-highrise projects that deliver in one-to-two buildings. As a result, average delivery amounts per property are higher and can have a larger near-term impact on the overall unstabilized/under construction occupancy rate.”
Colliers used population projections from the Arizona Office of Economic Opportunity as a source, noting, “From 2010, the overall average annual growth rate for Phoenix has been 2.4% with a per year range of 2.26% (high) to 1.48% (low).”
Based on the 2020-2025 population growth projections, Phoenix will need 47,078 units on the low end, 61,339 at the average rate of 1.75% and 83,658 at the high estimate of 2.25%.
Household size is a key factor in determining demand. The average renter household size for urban areas is 1.9 people, growing to 2.9 for suburban-to-rural areas. The Colliers update used a household size of 2.75 for its projects, a number it refers to as “very conservative.”
In determining the metro Phoenix rate, Colliers sampled properties across the Valley to establish a representative cross section and analyzed the total units across those properties.
The analysis showed an average persons per household of 1.52, significantly lower than the averages. Keep in mind that the fewer people there are per household, the greater the number of spaces needed for them to live.
One factor this report examined that many do not take into consideration is the number of persons per bedroom in a household, which Colliers calculated to be 1.14.
In properties of more than 50 units, CoStar shows a metro Phoenix inventory of 325,513 units, which Colliers extrapolated to a bedroom count of 513,037.
Given the inventory count and subsequent estimations, 1.14 persons-per-bedroom yields 1.79 people-per-unit. This is a point of concern because, as the report states, “These numbers are considerably less than the Person per Household estimates used by both Census and projected Demand Chart above; as such, implies that Phoenix is considerably more undersupplied than previously thought.”
A greater-than-estimated undersupply could have ripple effects that stretch farther and last longer than previous best/worst case scenarios.
Other key points discussed include:
- Occupancy Rate: Currently 96.2%, 50 basis points higher than the five-year average;
- Net Domestic Migration (2010-2021): 550,258;
- Phoenix Renter Income Growth: +51.9% to $5,929;
- Phoenix Current Average Mortgage Payment: $2,984;
- Phoenix Current Average Rent Payment: $1,676;
- Phoenix Pre-lease Absorption Rate: 12 units/property/month;
- Phoenix Delivery-to-Stabilization Period: 19 months (Developer Target: 18-24 months)
Taken all together, the report shows what we already know about the state of Phoenix-area multifamily supply and demand, and it indicates the industry’s collective degree of concern may not actually be worried enough, given the totality of conditions.
In an email exchange discussing the report, Brophy summarized his thoughts by saying, “Since 2016 I have been a staunch advocate for increasing housing construction. While some progress has been made, specifically in units under construction, as the analysis shows, it is still not enough. In fact, if less conservative estimates were used to better match the ‘on the ground’ observations, projected unit deficits would be significantly higher.
“Rampant, sustained inflation seen throughout the US and world economies, combined with unrelenting supply chain issues, means, at least to my mind, housing shortages will remain significant in the near-to-medium terms.”
Murphy, R. & https://azbex.com/. (2022, August 23). Phoenix among Top 10 markets for multifamily investment in 2023. Https://Azbigmedia.Com/. Retrieved February 7, 2023, from https://azbex.com/trends/demand-report-shows-phoenix-multifamily-20k-units-short/